
 Master of Public Policy
 Master of Public Affairs
 Master of Development Practice
 Doctoral Program
 Global and Executive Programs
 Undergraduate Programs

 Diversity, Equity, Inclusion
 Student Groups
 Alumni
 Directories
 Faculty
 Publications
 Working Papers
 Centers
 News Center
 Policy Initiatives

 For Students
 For Employers
 Career Events
 Employment Statistics
 Client-based Projects
 About GSPP
 Events
 Make a Gift
 Find a Program
 Find a Faculty Member
 Find a Center
Guidance for cookstove offset buyers
We recommend choosing projects that:
1. Distribute healthy stoves
Look for projects that distribute stoves with substantial health benefits. While all efficient cookstoves projects should reduce smoke, only some reduce smoke enough to significantly improve respiratory health and save lives (this graph explains why).
⇒ Clean Cooking Alliance's database of stove health ratings. To meet WHO health standards stoves must meet Tier 4 or above for particulate matter and Tier 5 for carbon monoxide based on laboratory-derived ratings.
⇒ Our summary list of stoves types that meet WHO heath standards (all involve fuel switching)
2. Use the Gold Standard (GS) Metered Methodology
Look for credits issued under the Gold Standard’s Methodology for Metered and Measured Energy Cooking Devices. This methodology directly monitors fuel use and as a result most accurately estimates actual emissions reductions.
Credit buyers should be skeptical of projects that could easily use GS metered (such as LPG, electric, ethanol, pellets) but instead choose to register under a less robust methodology. Such projects could be choosing to produce less verifiable, higher volume, and lower quality credits. We recommend any purchased fuel projects be registered under GS Metered.
3. Use accurate and conservative values for calculating emissions reductions
Projects should choose accurate fNRB values and ideally account for rebound.
Fraction of non-renewable biomass (fNRB)
The concern: Previously, all methodologies relied on inaccurate CDM default values to estimate fNRB. As these defaults have now expired, projects may calculate fNRB values from a CDM tool or assume a conservative 30% default (rarely chosen). Project fNRB values from the CDM tool or expired CDM default values have been much higher than those from peer reviewed literature that accounts for biomass regrowth, and geographical, ecological, and land use heterogeneity at the sub-national level, leading to over-crediting.
► What you can do: The project’s fNRB is listed in all monitoring reports. Simply search for "fNRB" and you’ll find the value used in a box similar to this one, which has been formatted to look like GS documentation:
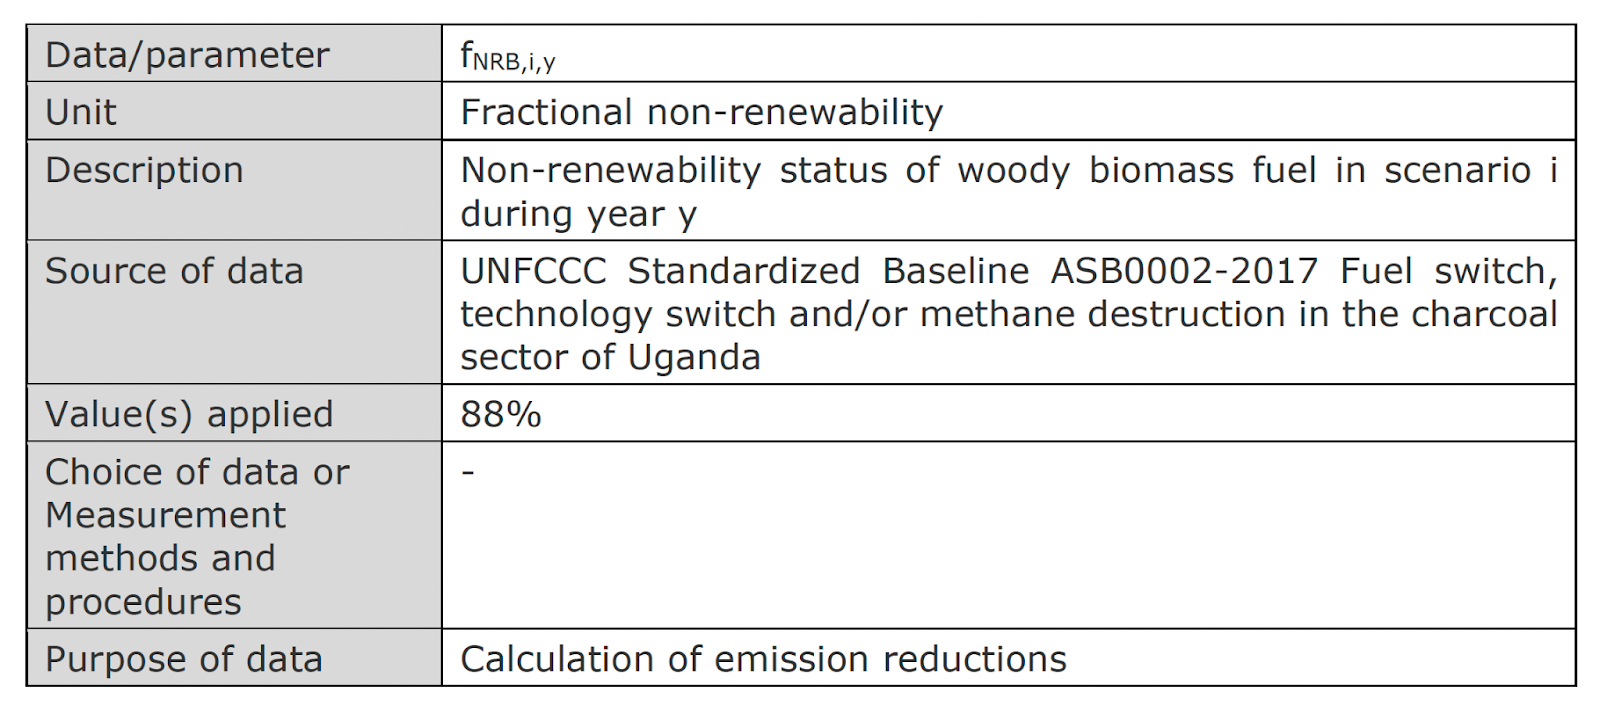
You can compare the figures used with appropriate values from the literature. The most accurate published values are from the dynamic landscape model called MoFuSS (Modeling Fuelwood Sustainability Scenarios), which was commissioned by the UNFCCC. To see fNRB values you can click on the countries in the MoFuSS default scenario map. You can also scroll in on the map to see values at the state/province and municipality/community levels. However, values aren't yet available for every location. If the project location isn't listed on the map, then you can refer to this spreadsheet for instructions on identifying the previous best estimates (from Bailis et al. 2015). The most accurate fNRB figures are at the smallest administrative level for firewood (country-wide figures for projects with national scopes), and country-wide values for charcoal.
Rebound
The concern: Rebound occurs when households increase the amount they cook in response to the introduction of an improved or clean stove. Rebound is common with efficient cookstoves and many other types efficiency improvements. It can also happen if households could not previously afford the fuel needed to cook as much as they would like to for their families; this form of rebound is due to "suppressed demand." There are mixed views on whether this should be taken into account in carbon benefit calculations. GS Metered only credits for the amount the project stove is used, but assumes static energy consumption. Thus, the methodology does not avoid over-crediting from rebound.
Currently, only GS TPDDTEC accounts for rebound. We hope that in the future, the other methodologies will explicitly account for rebound to avoid overcrediting. We estimate that otherwise accurate projects are likely to still overestimate their climate benefits on average by around 22% by not accounting for rebound.
► What you can do:
We recommend non-GS TPDDTEC projects either discount their emissions by 22% (a literature-derived estimate; see our article for discussion of how we obtained this estimate) or robustly track stacking through longitudinal surveys.
If the project takes a rebound deduction, you will find it listed in the monitoring report. Monitoring Reports are typically split into parameters that are (1) fixed ex-ante and (2) monitored during the period. If the project is tracking rebound or opting for the default discount, there will be a new “box” for rebound (similar to above one for fNRB).
If they are tracking rebound using survey data, you’ll also need to check the quality of the rebound survey. If an excel sheet outlining the emission reductions is available, there might be a tab with the survey results; alternatively, the project may provide the survey in their project pages. See our Guidance on Survey Design for tips on how to assess the quality of a survey.
All other factors
For non-GS Metered projects, you can see if the projects follow the recommendations from our journal article (see table below). But remember, only projects that use a stove from this list improve indoor air quality enough to significantly improve health.
Recommendations
To avoid over-crediting project developers should choose
| Factor | Recommendation |
| Fraction of non-renewable biomass (fNRB) | See discussion above |
| Adoption, usage, stacking, and rebound |
One of the following options:
Stove adoption rate: 58% |
| Fuel consumption |
Initial and updated baseline KPTs and/or robust project-led surveys. Baseline fuel consumption should not be greater than 4 MJ-delivered/capita/day, and project fuel consumption should not be less than 2 MJ-delivered/capita/day. See our Guidance on Survey Design |
| Emissions factors | See discussion here |
Where to find these figures?
All projects should be listed in the Gold Standard or Verra project registries, where you can search for them by project ID or project name. Other helpful resources for finding projects are the Voluntary Registry Offsets Database, which lists all projects and tracks all credits from Gold Standard, Verra, and other major offset registries (updated approximately every quarter) and the Voluntary Carbon Market Cookstove Baseline and Project Fuel/Stove Database, which lists details about all cookstoves projects, and was last updated November 2022.
On the project pages you will find several types of key documents:
The Project Description Documents describes the project at its start. This document lists some figures that are used throughout the crediting period, including methodology used, stoves deployed, applied emission factors (EFs), fNRB (optional to update), and assumed baseline fuel consumption.
Monitoring reports describe all data that is monitored over time, like stove usage data, and presents all figures used to calculate emissions reduced and credits to be issued. It is best practice to check the most recent monitoring report to determine the actual project activities. Often the Project Description Document may give a range of stove designs the project might implement, but in the monitoring report, you will find the actual stove type deployed. The monitoring reports should also include all parameters given in the Project Description Document, such as fNRB or EFs.
Validation and verification reports are written by the third-party auditors hired by the project developers to audit both project description documents and the monitoring reports, including through site visits. Validation reports cover the project description at the start of the project and perhaps the first monitoring report; verification reports cover the monitoring reports before each credit issuance.
Other documents may also be listed on the project pages, including samples of the surveys used, or spreadsheets with project data.
List of quality projects
We are maintaining a list of cookstoves offset projects that generate high quality credits here.